Deep Dive into Tableau PostgreSQL Repository
Part 4 of 5: PostgreSQL Repository
Using the PostgreSQL Repository (On-Prem)
Because I run an on-prem Tableau Server, I can directly query the Tableau PostgreSQL repository (the workgroup database). On Tableau Cloud, you can only connect to a few pre-aggregated published data sources and use the “Admin Insights” dashboards — direct repository access is not available there. See Part 2: Tableau Cloud vs On-Premise — Metadata Access Comparison for the full breakdown of what changes when you move off-prem.
Setting up access on-prem requires a TSM command to enable a readonly user, after which any standard PostgreSQL client can connect to workgroup.
What is the value in the Repository?
The PostgreSQL repository unlocks capabilities far beyond Tableau’s default admin views in the “Server/Site Status” section, and gives you the opportunity to build complex data models customized for your specific business case. Here’s how it transformed our BI operations:
- Deeper auditing: we started to track granular user activity — who accessed sensitive workbooks, historical logs (e.g. who created or removed a specific user), and usage metrics (e.g. workbooks that were never popular despite a high priority in their development).
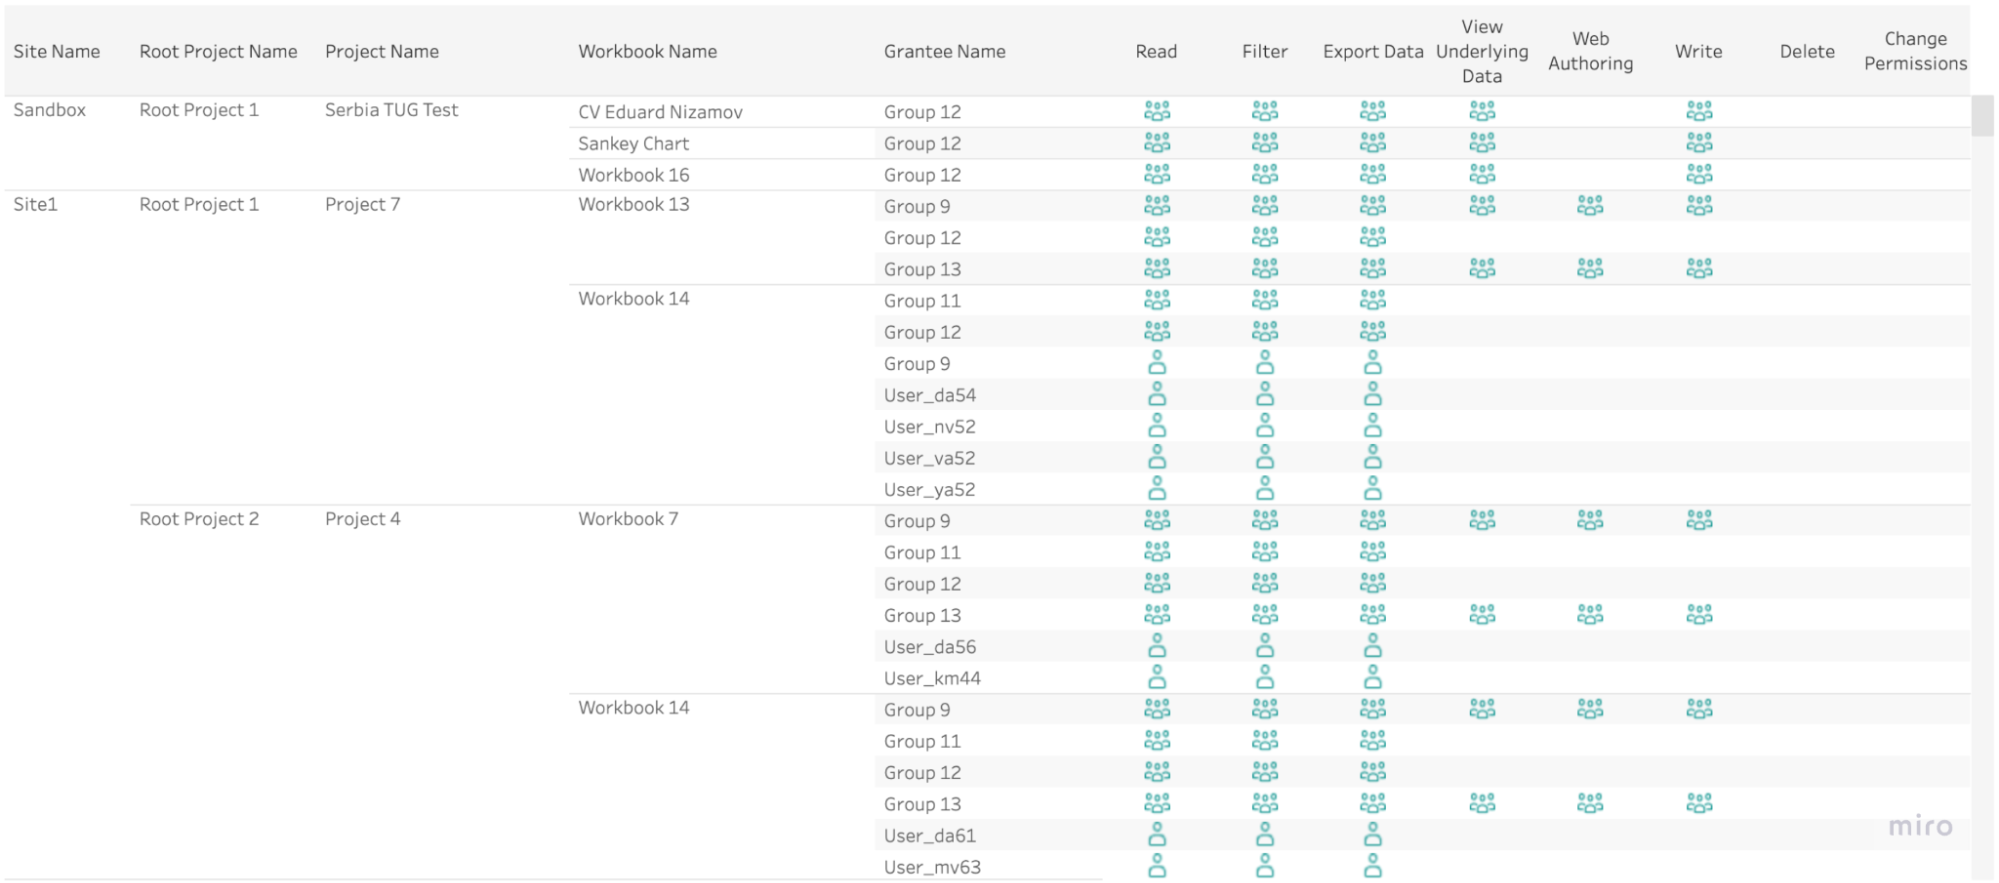
- Permissions: I built a permissions matrix by joining and unioning multiple tables. This lets BI/Data department employees easily find all rights granted to any user or group. In a second iteration, we extended access to Business Unit managers so they could see permissions only for users relevant to their department and track ownership of their own dashboards.
- Data hygiene: we use repository data to identify inactive users and duplicate accounts that clutter the server and waste licenses.
Sample SQL Queries
Building a Permissions Matrix
One of my biggest wins was constructing a table that shows exactly which user or group has Read, Write, or Delete on each workbook. To build this matrix, I combined data from several key tables (primarily next_gen_permissions, workbooks, users, groups, projects, and sites).
The query joins permissions data with workbooks, projects, users, and groups, so I can clearly see:
- Who (user or group) has permissions.
- What exact permissions they have (read, write, export).
- Where these permissions apply (specific workbook, project, and site).
Here’s a simplified version of the query I use:
SELECT
    w.name              AS workbook_name,
    p.name              AS project_name,
    perms.grantee_type,
    cap.display_name    AS capability,
    perms.permission,
    CASE
        WHEN perms.grantee_type = 'User'  THEN su.friendly_name
        WHEN perms.grantee_type = 'Group' THEN g.name
    END                 AS grantee_name
FROM next_gen_permissions perms
JOIN capabilities cap
    ON perms.capability_id = cap.id
LEFT JOIN workbooks w
    ON perms.authorizable_id = w.id
   AND perms.authorizable_type = 'Workbook'
LEFT JOIN _workbooks _w
    ON w.id = _w.id
LEFT JOIN projects p
    ON _w.project_id = p.id
LEFT JOIN users u
    ON perms.grantee_id = u.id
   AND perms.grantee_type = 'User'
LEFT JOIN system_users su
    ON u.system_user_id = su.id
LEFT JOIN groups g
    ON perms.grantee_id = g.id
   AND perms.grantee_type = 'Group'
WHERE perms.authorizable_type = 'Workbook';
I then visualized this in a custom admin dashboard: columns for each workbook, rows for each user/group, with shapes or color coding for read/write. This matrix helps us check the current state and helps business leads request changes when employees no longer need certain privileges.
Checking Duplicate Emails
Due to imperfect internal processes, we sometimes ended up with users having multiple accounts under different logins — particularly common when employees changed departments. We surfaced these by searching for duplicate email addresses:
SELECT
    email,
    name
FROM (
    SELECT
        email,
        name,
        COUNT(*) OVER (PARTITION BY email) AS email_count
    FROM system_users
    WHERE email IS NOT NULL AND email <> ''
) t
WHERE email_count > 1
ORDER BY email, name;
This simple yet effective query highlights all repeated emails so we can deactivate the redundant ones.
Identifying Underused Dashboards
One of the most valuable insights I extracted from the repository was finding previously popular dashboards that users had stopped using. This early-warning signal lets us proactively reach out to stakeholders, understand what isn’t working for them, and improve our product in the next iteration.
Here’s the query I used to spot dashboards with significant usage decline:
WITH access_events AS (
    SELECT
        he.id,
        he.created_at,
        he.hist_view_id,
        he.hist_workbook_id
    FROM historical_events he
    JOIN historical_event_types het
        ON he.historical_event_type_id = het.type_id
    WHERE het.name = 'Access View'
),
dashboard_stats AS (
    SELECT
        hw.name                                   AS workbook_name,
        hv.name                                   AS view_name,
        p.name                                    AS project_name,
        COUNT(
            CASE
                WHEN ae.created_at >= NOW() - INTERVAL '30 days'
                THEN 1
            END
        )                                         AS recent_views,
        COUNT(
            CASE
                WHEN ae.created_at BETWEEN NOW() - INTERVAL '60 days'
                                       AND NOW() - INTERVAL '30 days'
                THEN 1
            END
        )                                         AS previous_views,
        MAX(ae.created_at)                        AS last_viewed_date
    FROM access_events ae
    LEFT JOIN hist_views hv
        ON ae.hist_view_id = hv.id
    LEFT JOIN hist_workbooks hw
        ON ae.hist_workbook_id = hw.id
    LEFT JOIN projects_contents pc
        ON pc.parent_type = 'Workbook' AND pc.content_id = hw.id
    LEFT JOIN projects p
        ON pc.project_id = p.id
    WHERE hw.id IS NOT NULL AND hv.id IS NOT NULL
    GROUP BY hw.name, hv.name, p.name
)
SELECT
    workbook_name,
    view_name,
    project_name,
    recent_views,
    previous_views,
    ROUND(
        100.0 * (
            NULLIF(previous_views, 0)
        )::numeric, 2
    )                                             AS pct_change,
    last_viewed_date,
    EXTRACT(DAY FROM NOW() - last_viewed_date)    AS days_since_last_view
FROM dashboard_stats
WHERE recent_views < previous_views * 0.7
ORDER BY pct_change ASC;
This query identifies any dashboard where usage has dropped by 30% or more compared to the previous month. When we investigated these declining dashboards by talking directly with business teams, we discovered several issues they hadn’t reported:
- Performance issues: a dashboard became too slow after Data Engineers updated logic in the underlying data sources without our awareness — users didn’t complain, they just stopped using it.
- Shadow BI tools: some departments started using Excel or free BI tools for self-service because they needed specific calculations — something they never mentioned to the BI developers.
- Training gaps: newcomers simply didn’t use some dashboards because of onboarding issues on the business side — our investigation even helped identify operational gaps in the company’s workflow.
These examples show what’s possible with PostgreSQL repository access in general; your specific implementation will vary greatly depending on your organization’s context — business size, user base, centralized vs decentralized development model, self-service adoption, and permission management approach.
Rather than guessing how dashboards are used, repository data gives you the opportunity to deeply investigate what exactly is happening.