Tableau Extensions: From Workarounds to Internal Products
Based on my Cyprus Tableau User Group talk
Cyprus Tableau User Group talk write-up
I recently gave a talk at Cyprus Tableau User Group called Tableau Extensions: From Workarounds to Internal Products — you can watch the full recording on YouTube.
This is about Tableau work that starts as a workaround, then becomes something people use again and again.
My claim is simple:
Why Extensions?
Tableau teams are already good at workarounds. That is one reason we like Tableau: dual axes, parameter actions, set actions, dynamic zone visibility, and so on.
And, let’s be honest, it is also one of the reasons we hate it from time to time.
Many requests are very specific: KPI comparison logic, flexible calendar presets, a customer journey-style flow, or a real multi-select parameter. The business rule is usually the important part.
That is why I build more of these myself now. With a reusable base, changing a focused extension is often faster than bending a generic product again.
LLM tools made the coding part cheaper. The harder questions are production questions: where it runs, what data it reads, who approves it, where tokens live, and who supports it.
The goal is not localhost hacks. The goal is reusable architecture.
In practice, that means a data contract, hosting option, security review, and CI/CD flow.
Workbook hack
Useful, fast, and often painful to rebuild.
Focused extension
Same business need, but packaged as a reusable tool.
Basic Setup
The examples make more sense with one architectural baseline.
A Tableau extension is a small web app integrated into a Tableau dashboard as an iframe.
It is loaded from a URL and talks back to Tableau through the Extensions API.
The .trex file is the manifest: name, type, permissions, and URL. After that, this becomes a normal web project with hosting, versions, and release control.
There are two main types. Viz Extensions add new visualization types to worksheets. Dashboard Extensions are embedded UI blocks inside dashboards.
Custom visualization type
Used on a worksheet through the Marks card. The extension renders the visual instead of a native mark type.
Embedded UI block
Placed inside a dashboard layout. It can become a tool panel, workflow screen, assistant, or admin interface.
That is the general idea of how extensions work. I covered the lower-level architecture and security model in a separate article on how Tableau extensions actually work, so this part stays short here.
Hosting depends on the data path. Static hosting is enough for pure visual helpers. If you need tokens, write actions, audit logs, or Tableau Server APIs, you need a backend.
For BI teams, I would keep the rule simple: start small. But if real data, secrets, or permissions are involved, bring DevOps and IT security in early.
Example 1: KPI Card
First: KPI Card.
One “simple” KPI card can become 10+ calculations, several worksheets, sparkline logic, period comparison, and layout tricks. You know the routine.
It is not impossible, just painfully repeatable.
Next metric, next dashboard, next stakeholder. It eats real development time.
With the KPI Card extension, you choose a measure and a date field, and the card renders the rest: sparkline, delta, previous period comparison, status bar, highlights, chart switching, styling. Same business outcome, much less manual dashboard work.
for one "simple" KPI card
And then you repeat the same construction for the next metric, next dashboard, next stakeholder.
Choose measure + date field. The card renders the rest.
Same business outcome, but packaged as a reusable configuration.
The same pattern can be repeated across metrics. Each metric has its own card and chart.
Configurations and formatting are not rebuilt by hand for every dashboard. You can even copy-paste configs between different workbooks.
KPI Card is a clean front-end example: it reads Tableau data in the dashboard context and renders a visual. No backend, no tokens.
Example 2: DendroMap Explorer
DendroMap Explorer came from a different shape problem.
The real use case was closer to a customer journey map: I needed a tree-like view for a specific process, and Tableau did not have a native chart that matched it cleanly.
The DendroMap Explorer extension reads summary data from a worksheet and renders the structure inside the dashboard. Search, zoom, export, and expand-collapse controls sit around the view.
I needed a customer journey view, and Tableau did not have that shape out of the box. This is basically why I built the extension.
Example 3: Workspace Extension
Workspace Extension is less about charts and more about adoption.
It is important not only to find dashboards, but to make people really use them.
The green and orange flags show what is new and what is not reviewed yet.
Small confession from the demo: I actually missed the orange UAT flags in the recording, but trust me, they are there in production.
That helps trigger users to open dashboards, check their part, and finish acceptance instead of leaving a published workbook in some unclear “probably fine” state.
The structure can be built from Tableau REST API or repository metadata: projects, workbooks, views, owners, and status. The extension turns that into a workspace with a tree, cards, search, filters, and favorites.
Honestly, this could be a standalone product outside Tableau. But inside Tableau we get a useful security boundary: Tableau already handles sign-in, and the tool is not exposed as a separate public page. For internal BI workflows, that is often enough reason to keep it as an extension.
Example 4: User Management Portal
User Management Portal changes the definition of extension again.
This is not a visualization. It is an operations tool embedded into Tableau.
User Management Portal wraps the Tableau Server REST API into one interface. You choose a site, user, or group, then select projects, workbooks, or individual dashboards and grant access to all selected objects in one action.
It also covers licensing, group membership, and copying access from one user to another.
The point is maximum flexibility and speed for repetitive access work.
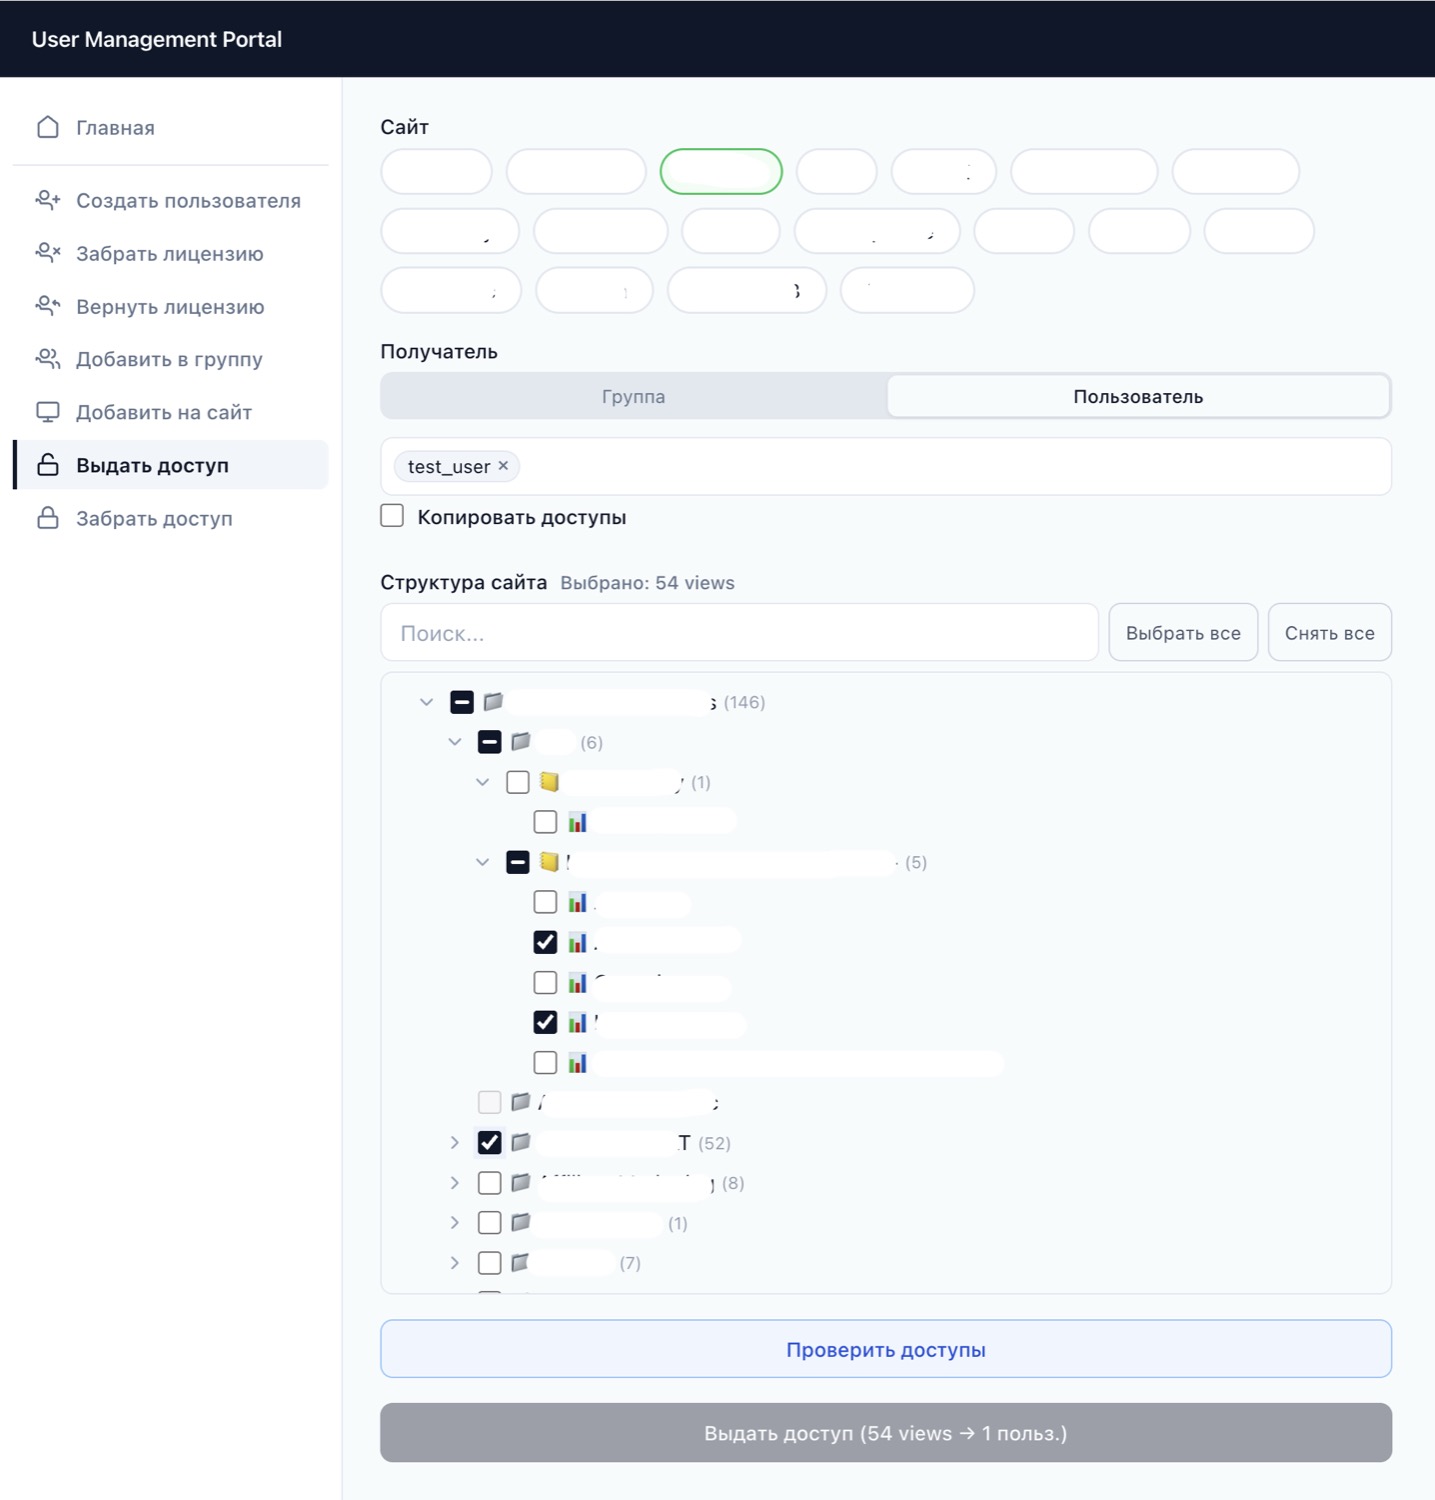
Same logic as with Workspace: this could live outside Tableau, but the extension format covers the sign-in part for us. From a security point of view, that is simpler than exposing another entry point for an admin tool.
The backend calls the Tableau REST API, but Personal Access Tokens (PATs) are not stored in the browser; they stay server-side and encrypted.
The saving is very practical. Depending on the task and the volume, this can save hours of one BI analyst’s work.
Example 5: AI Assistant
The AI Assistant is where the same extension model meets LLM tooling.
Everyone has an AI button now. Tableau has Pulse and Tableau Agent, and that is great, but not every team can use the newest Cloud-only features. A lot of companies still live on Tableau Server.
So this was my AI assistant experiment: what if the assistant lives inside the dashboard and works with the data and context the user is already looking at?
In the demo, I am not asking one small question. I ask the assistant to build a complete Superstore dashboard: KPI cards, charts, a detail table, and insights.
The extension is only the UI layer. In this setup, the front end is hosted on Netlify, the backend runs on a VPS, and Tableau MCP queries Tableau through VizQL Data Service.
This is one possible interface for that workflow. Another option is direct interaction between Claude Code and a server. The extension version is useful when the dashboard itself matters: current filters, current visuals, current datasource.
This is the full canvas mode.
By default, the same assistant can also be a chat panel on the side of an existing dashboard, hidden behind a button if needed. In that mode, the idea is close to Claude Code: the assistant uses tools to answer questions, but it can also generate interactive visualizations directly inside the Tableau extension.
Full canvas is the bigger self-service version: it renders visuals on the page and can save them as a dashboard.
Hosting
Hosting starts with one simple fact.
Tableau does not magically host your extension.
The .trex file points to a URL, and Tableau loads that page inside the workbook.
This works the same for Tableau Cloud and on-prem Tableau Server. The URL must be HTTPS, and the site admin adds the extension URL to the safe list in the site settings.
Static host
Netlify, Vercel, or any reliable static HTTPS host can be enough. The extension receives workbook data through the Tableau Extensions API, renders the visual, and shows it back inside Tableau.
Use for: visual helpers like KPI Card or DendroMap.
Data: workbook data through the Extensions API.
Rule: no backend, no Personal Access Tokens, no secret keys in browser code.
App with API
This is where UMP and the AI Assistant live. If the extension calls Tableau REST API, stores tokens, writes something, logs actions, or calls an LLM, the sensitive part should move to the server.
Use for: UMP, AI Assistant, admin workflows.
Needs: tokens, audit, approvals, write actions, LLM calls.
Rule: keep tokens server-side. Browser code is not a vault.
For smaller setups, that can be a VPS with Docker. Coolify is one possible tool here: it gives you a deploy panel, runs apps as Docker containers, and can keep frontend and backend in one place. The trade-off is simple: now Coolify itself needs access rules, updates, monitoring, and incident handling.
For corporate internal products, I would use the approved company platform if it exists. GitLab CI plus Kubernetes is one common version, but the exact brand names are less important than the pattern: approved repo, CI/CD, managed runtime, secrets, and release controls.
The Wider Point
The wider point is this.
LLM tools made internal apps and tools much cheaper to build. I am not saying they replace serious enterprise platforms. But for the layer of tools around BI workflows, admin tasks, dashboard helpers, and repeated manual work, the economics changed.
BI and Tableau are my example. We have always built around the platform: calculations, parameters, actions, layout tricks, admin scripts, and sometimes pure stubbornness. Now more of that work can move into proper internal tools.
That is why I stopped treating ready-made tools as the default answer. Sometimes they fit perfectly. But very often the valuable part is the company-specific part: your workflow, your rules, your data access, your approval path. Buying a large generic tool for a small specific pain can be expensive in a very boring way.
So my argument is this: if the workaround repeats, it is no longer a workaround. It is a product waiting to happen.
But it needs rails: data contract, hosting, security checklist, publishing steps, and a runbook. That is what makes it safe and stable enough.
And I think this is bigger than Tableau. Many IT teams will probably have more internal apps and tools, because building them is cheaper now. The question is not only “can we build it?” The question is: can we own it properly?