How Tableau Extensions Actually Work (And Are They Safe?)
Architecture, .trex Manifest, and Security
What Is a Tableau Extension?
A Tableau extension is a web application embedded into Tableau, connected through the Extensions API and registered by a manifest file.
That mental model is the key to everything that follows. An extension is not a plugin compiled into Tableau. It’s a separate web app that renders its own UI inside an iframe and communicates with the workbook through a JavaScript API bridge.
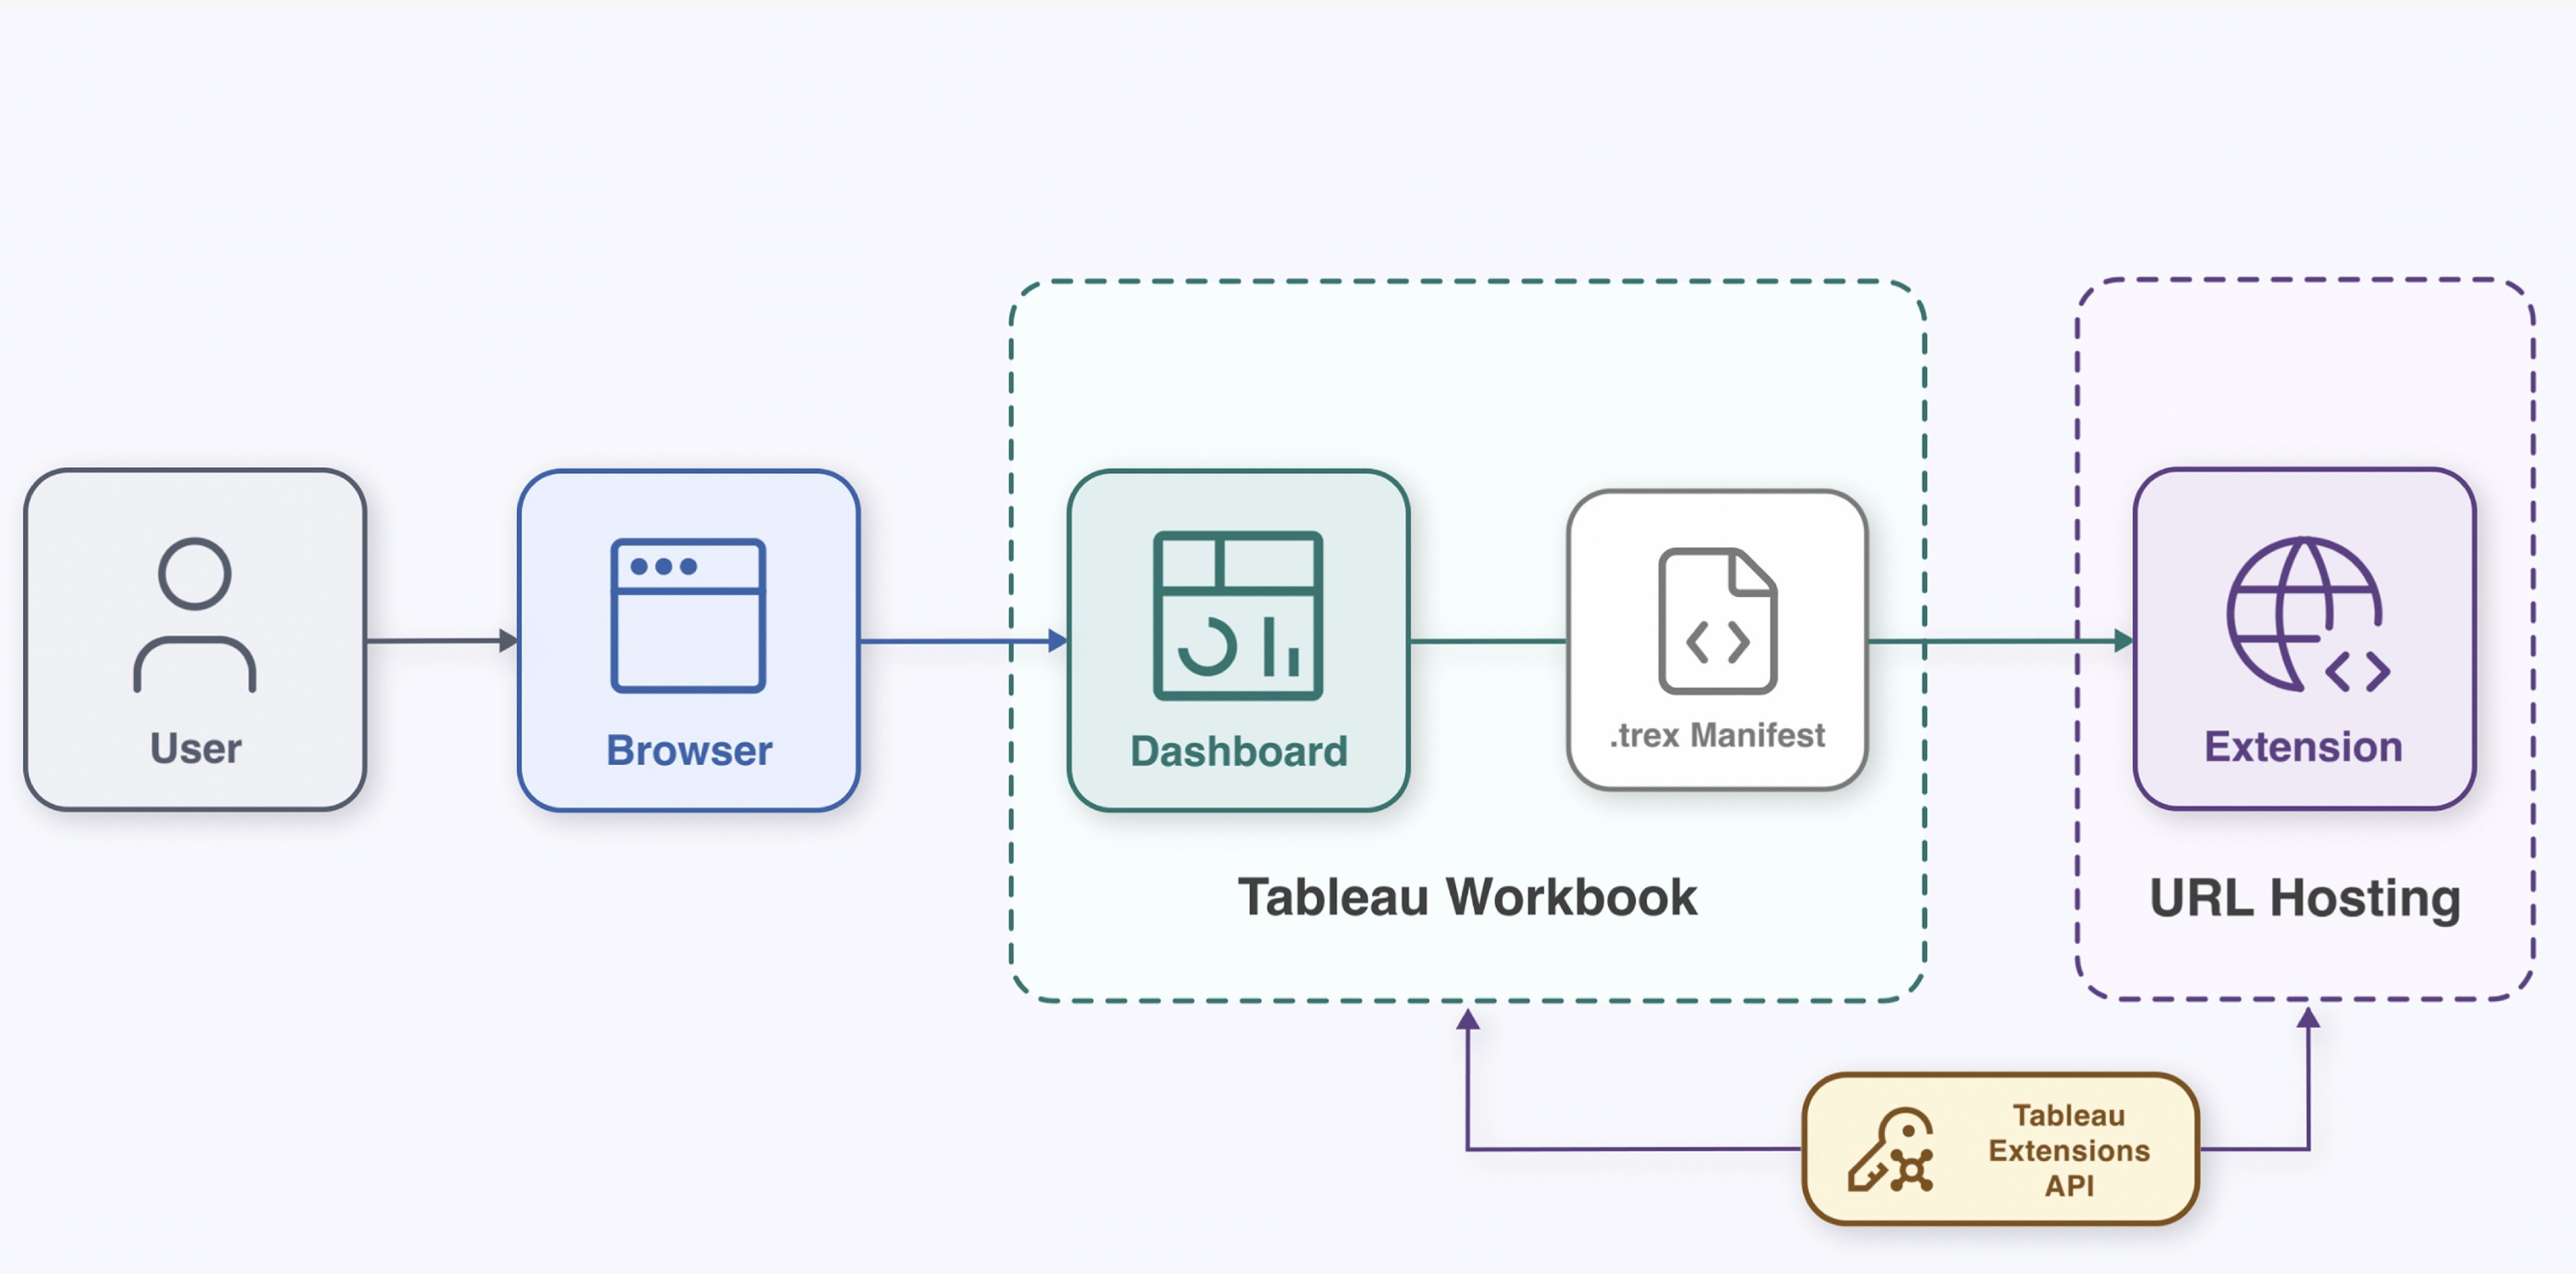
The flow:
- A user opens a dashboard in the browser
- The workbook contains a
.trexmanifest that points to a hosted URL - Tableau loads that URL in a sandboxed context
- The web app communicates back to the workbook through the Extensions API
If the extension is network-enabled, it can also make outbound web requests to external services. That’s where the security review becomes critical.
Two Types of Extensions
Dashboard Extensions
Added to a dashboard as an extension object. Occupies a zone on the layout. Can interact with worksheets, filters, parameters, and settings.
Viz Extensions
Added to a worksheet via the Marks card. Creates a custom mark type — the extension renders its own visual instead of bars or lines.
Both types use the same Extensions API and the same .trex manifest format. The difference is where they live: dashboard layout vs. worksheet marks.
The .trex Manifest
The manifest is an XML file that registers the extension with Tableau. Three things to check before you allow one:
URL
Where the extension is hosted. Is it HTTPS? Who controls the domain?
Permissions
Does it request Full Data Access or operate at view-level only?
Author
Who built it — name, email, organization, website.
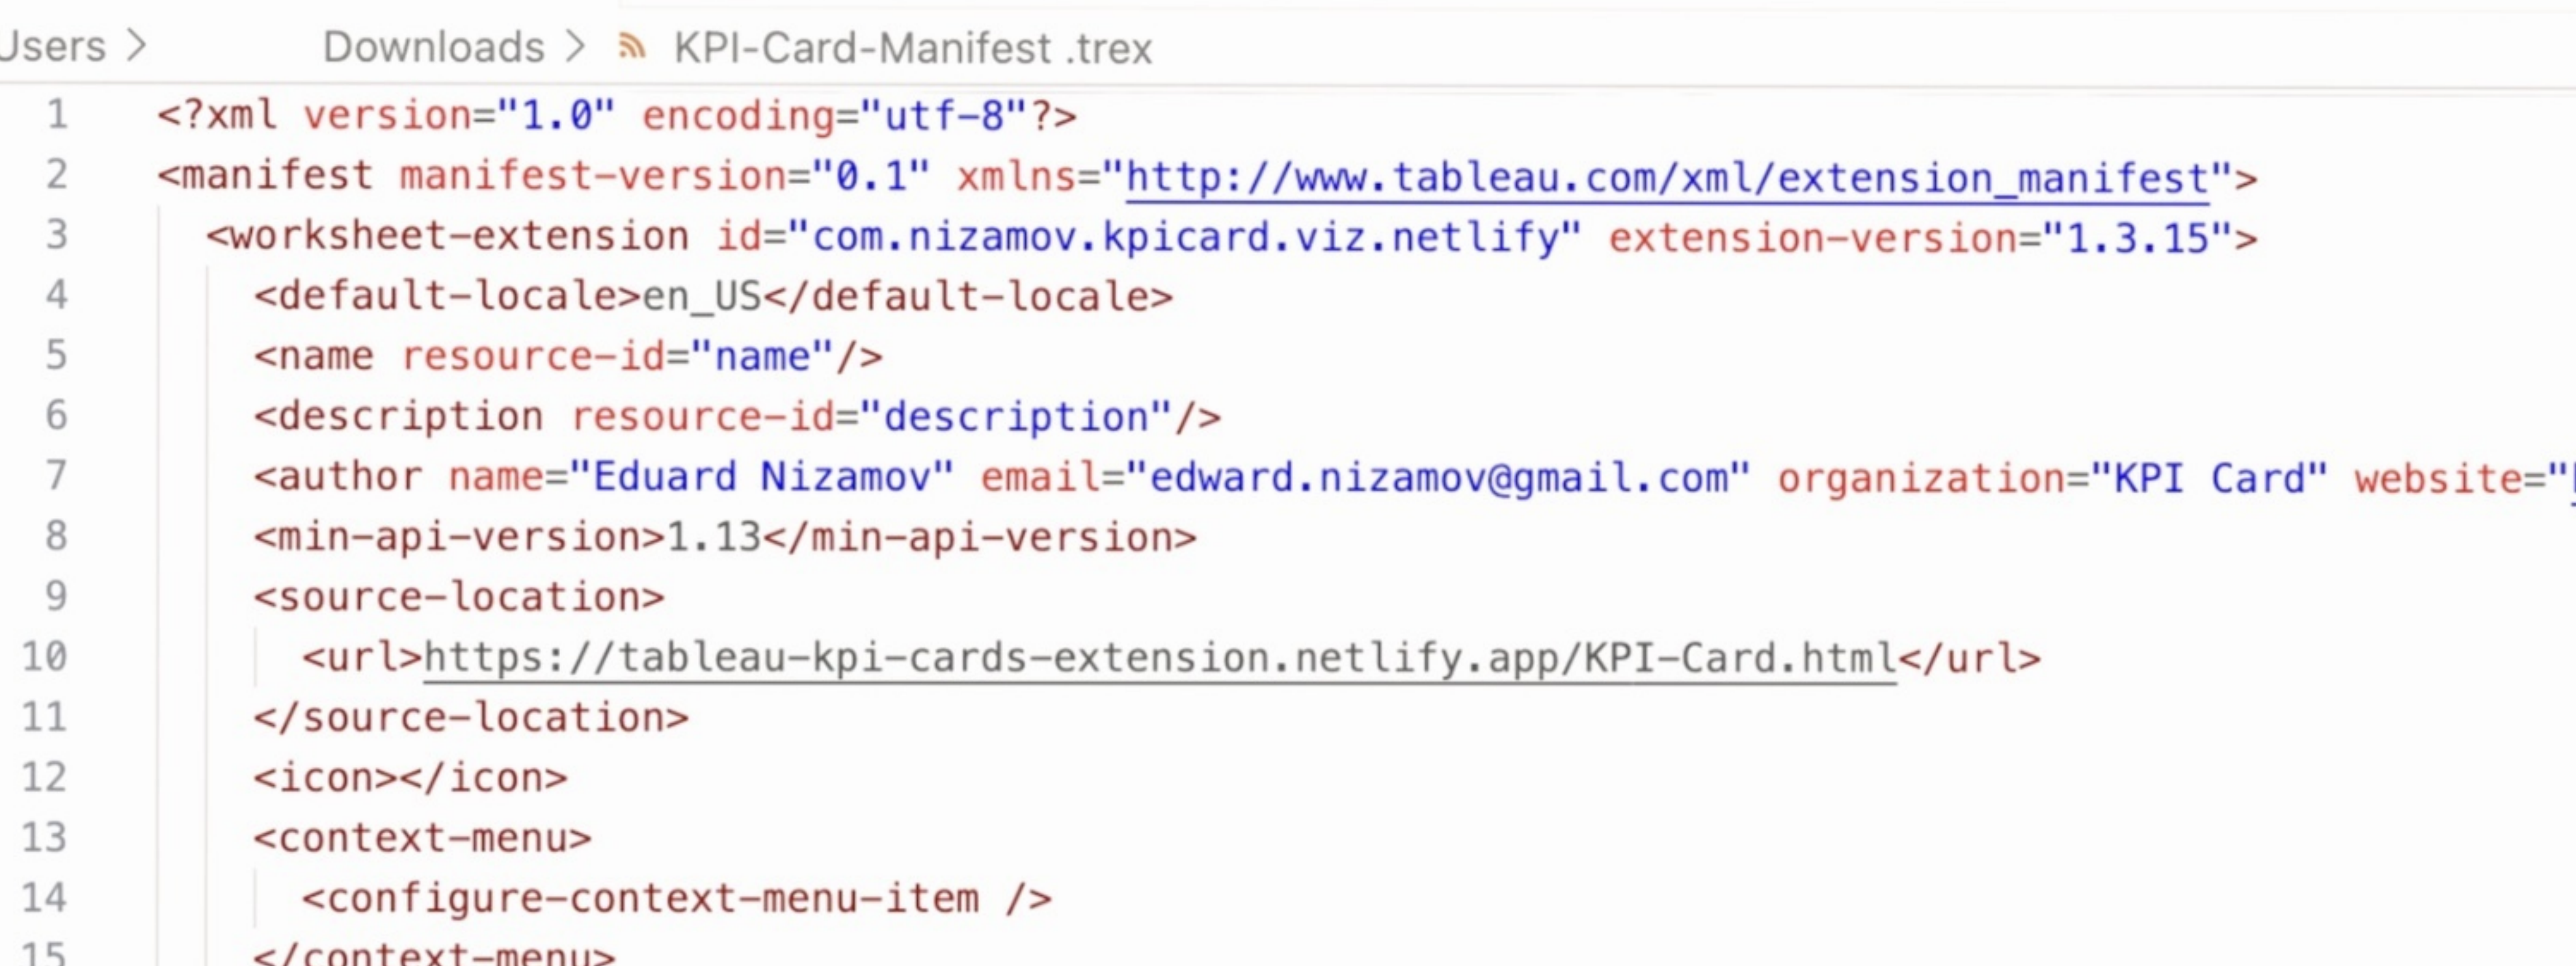
This is the first thing you review before allowing any extension.
Data Access Levels
Key distinction: no Full Data Access does not mean "no data." It means the extension operates at the view-summary level — the same data a user sees in the visualization.
Even without Full Data Access, extensions work with visible or summary data from the view. That’s how they calculate values, render charts, and respond to filter changes.
Full Data Access is a separate, explicit permission. It grants access to:
- Underlying row-level data
- Metadata — table names, field names
- Data source connection information
For many extensions, view-level access is sufficient. A KPI card, for example, needs a metric and a date from the view context. It computes everything on the client. Full Data Access is unnecessary.
Security in Practice
Extensions are web apps — review them like web apps.
Platform Controls
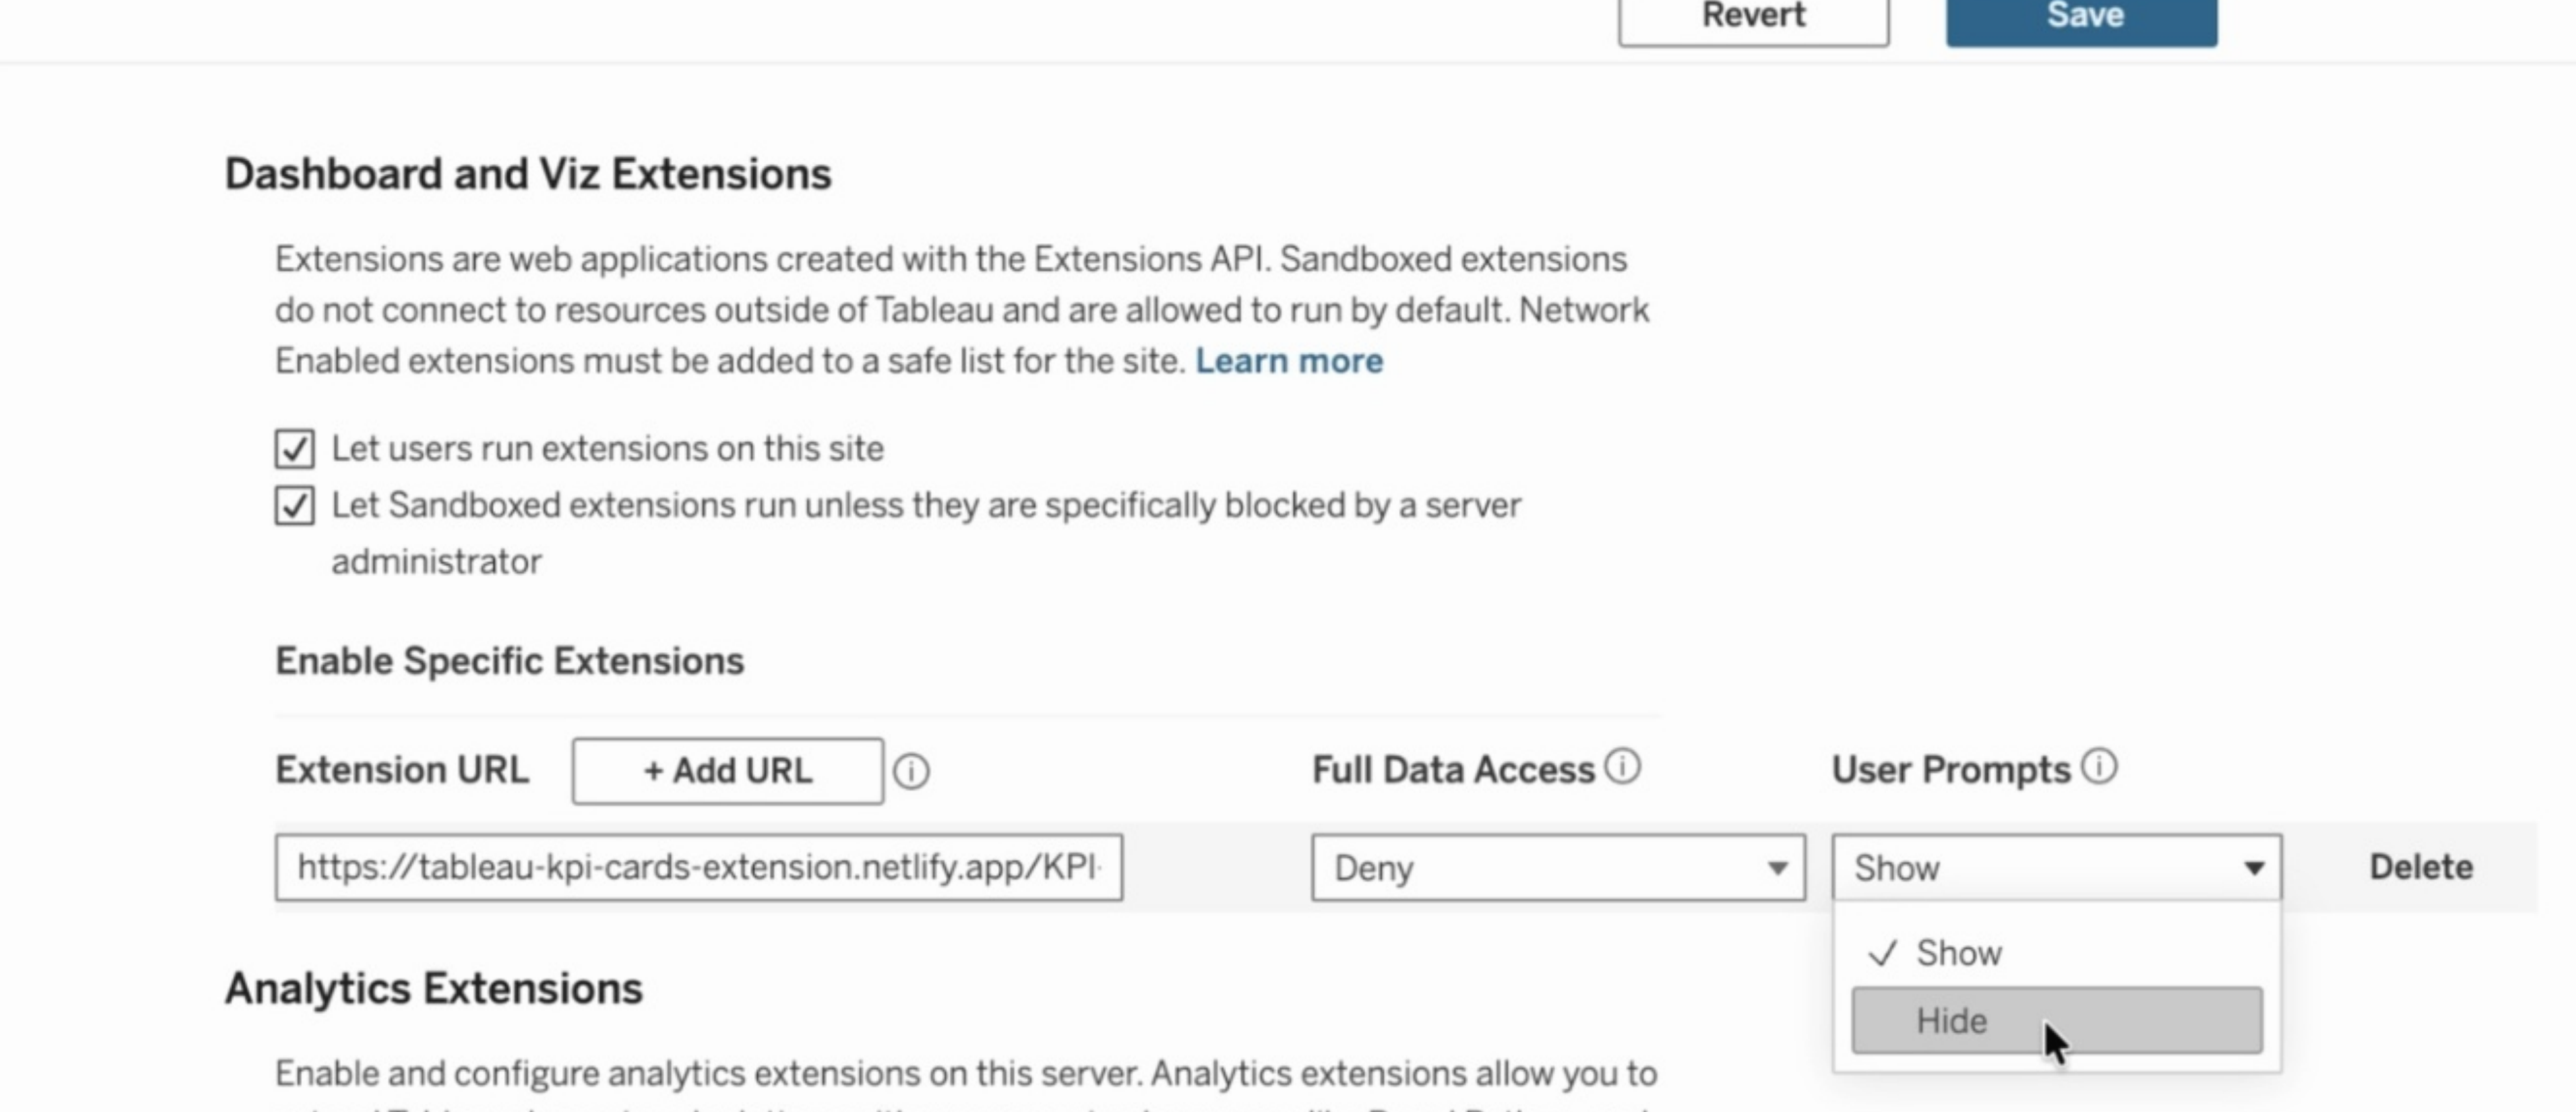
On Tableau Server and Cloud, administrators have granular control:
- Enable or disable extensions globally
- Block specific extensions by URL
- Manage safe lists — only pre-approved extensions can run
- Control Full Data Access — deny it even if the extension requests it
- Configure user prompts — show or hide the permission dialog
Checklist
- Check the .trex URL — HTTPS? Known domain? Who controls the hosting?
- Confirm permissions — Full Data Access requested? Is that justified?
- Deny Full Data Access unless needed — most viz extensions don't need it
- Validate network destinations — DevTools or proxy logs to inspect outbound calls
- Pilot in a test workbook — never deploy directly to production
Real Example: KPI Card
My KPI Card extension works as a Viz Extension:
- Drag the extension onto the Marks card as a custom mark type
- Assign a metric and a date field to the shelves
- The extension reads the view context through the Extensions API
- It computes current period, previous period, delta, avg, median, min, max — all on the client
- Renders the card with sparklines, trend indicators, and period comparisons
The entire workflow stays at the view-summary level. No Full Data Access. No outbound network calls beyond loading the extension itself.
Try the KPI Card live demo or download the .trex to test it yourself.